Climate Killer Carbon Dioxide
Contents
- Overview
- Table: Countries with the highest carbon dioxide emissions from fuel combustion, 2019
- Figure: Countries with the highest carbon dioxide emissions from fuel combustion, 2019
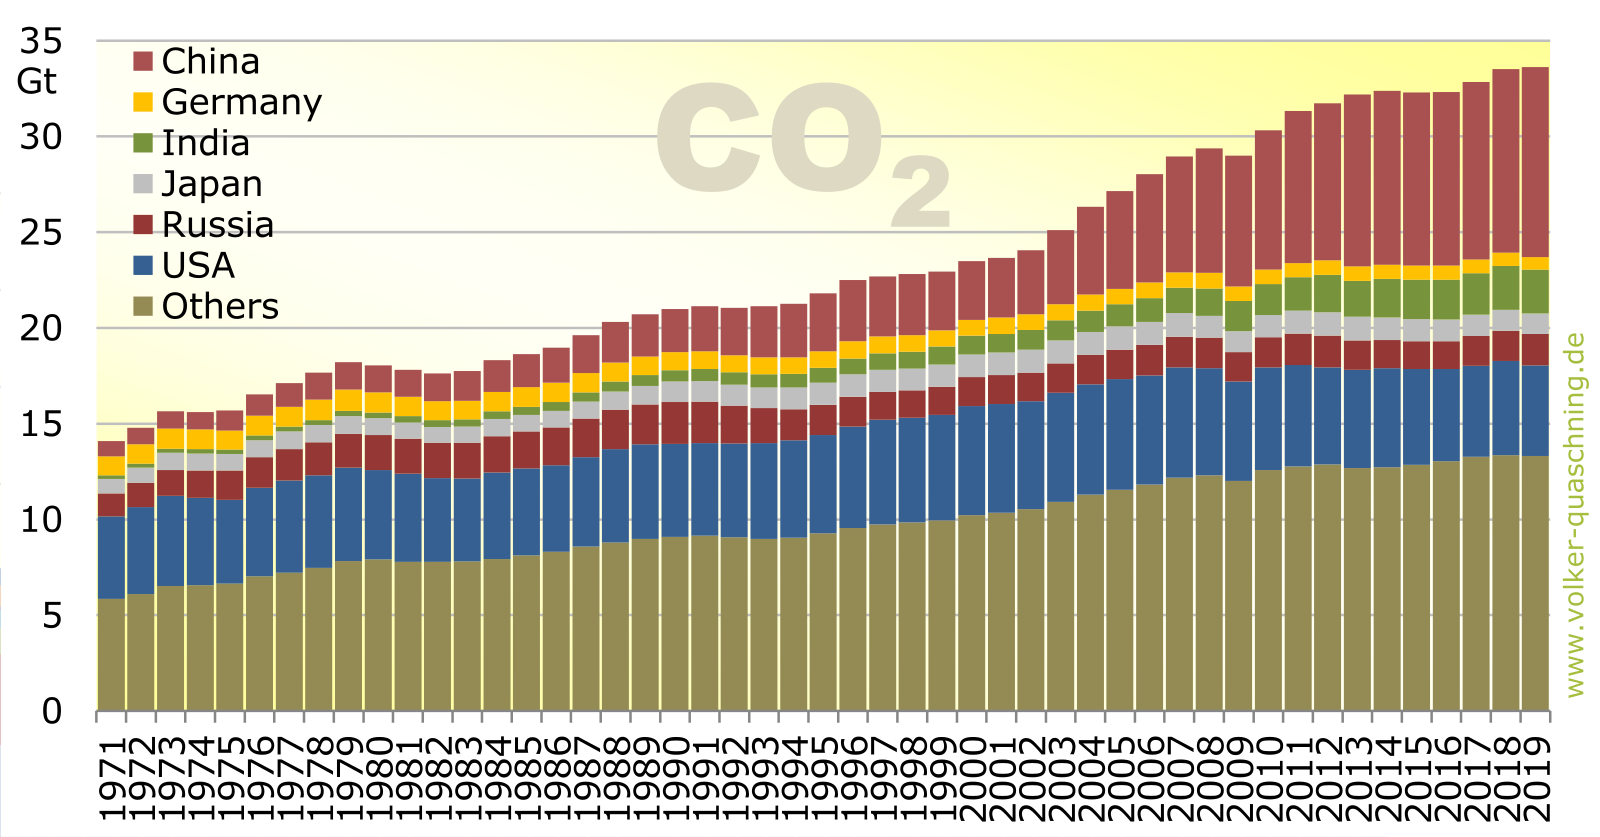
- Figure: Development of CO2 emissions from different countries
- Figure: Development of global CO2 emissions from fuel combustion and CO2 concentration in the atmosphere since 1860
- Table: Development of global CO2 emissions from fuel combustion and CO2 concentration in the atmosphere since 1860
Overview
Almost two thirds of the world's carbon dioxide emissions are caused by 10 countries, around a quarter and a sixth respectively by China and the USA alone. Germany is in 6th place in the hit list of climate sinners. Both the number of inhabitants and the per capita emissions play a role in the total emissions of a country. For example, one person in the USA produces almost twice as much carbon dioxide as one in Germany and more than eight times as much as one in India.
Global carbon dioxide emissions and carbon dioxide concentrations in the atmosphere are continuously increasing. Since 1970, global energy-related carbon dioxide emissions have more than doubled, and have even increased more than fifteenfold since the beginning of the last century. Since 2013, however, emissions have been rising at a much slower rate. This gives some hope that a stabilisation and then a turnaround of the trend can be achieved. Emissions fell in 2020 due to the consequences of the corona pandemic. However, this did not last: in 2021, the highest level of emissions in human history was recorded.
The concentration of carbon dioxide in the atmosphere has risen from around 290 ppm in 1860 to around 415 ppm today. A value of 450 ppm is widely regarded as the upper limit that should not be exceeded if possible.
| No. | Country | CO2 emissions in Gt | Per capita emissions in t |
| 1 | China | 9,92 | 7,1 |
| 2 | USA | 4,41 | 14,4 |
| 3 | India | 2,31 | 1,7 |
| 4 | Russia | 1,64 | 11,4 |
| 5 | Japan | 1,06 | 8,4 |
| 6 | Germany | 0,64 | 7,8 |
| 7 | South Korea | 0,59 | 11,3 |
| 8 | Iran | 0,58 | 7,0 |
| 9 | Indonesia | 0,58 | 2,2 |
| 10 | Canada | 0,57 | 15,2 |


Energy-related CO2 emissions including emissions from industrial processes. Source: IEA, NOAA, NOAA, PIK
| Year | CO2 emissions in Gt | CO2 concentration in the atmosphere in ppm |
| 2021 | 36,26 1) | 415 2) |
| 2020 | 34,22 1) | 412 2) |
| 2019 | 36,08 1) | 410 2) |
| 2018 | 36,06 1) | 408 2) |
| 2017 | 35,21 1) | 405 2) |
| 2016 | 34,63 1) | 403 2) |
| 2015 | 34,56 1) | 400 2) |
| 2014 | 34,66 1) | 397 2) |
| 2013 | 34,54 1) | 395 2) |
| 2012 | 33,87 1) | 393 2) |
| 2011 | 33,46 1) | 391 2) |
| 2010 | 32,43 1) | 389 2) |
| 2009 | 30,54 1) | 387 2) |
| 2008 | 30,94 1) | 385 2) |
| 2007 | 30,72 1) | 383 2) |
| 2006 | 29,57 1) | 381 2) |
| 2005 | 28,57 1) | 379 2) |
| 2004 | 27,54 1) | 377 2) |
| 2003 | 26,31 1) | 375 2) |
| 2002 | 25,18 1) | 373 2) |
| 2001 | 24,70 1) | 371 2) |
| 2000 | 24,34 1) | 369 2) |
| 1999 | 23,59 1) | 368 2) |
| 1998 | 23,42 1) | 366 2) |
| 1997 | 23,25 1) | 363 2) |
| 1996 | 22,83 1) | 362 2) |
| 1995 | 22,36 1) | 360 2) |
| 1994 | 21,74 1) | 358 2) |
| 1993 | 21,61 1) | 357 2) |
| 1992 | 21,48 1) | 356 2) |
| 1991 | 21,51 1) | 355 2) |
| 1990 | 21,39 1) | 354 2) |
| 1989 | 20,76 1) | 353 2) |
| 1988 | 20,34 1) | 351 2) |
| 1987 | 19,64 1) | 349 2) |
| 1986 | 18,97 1) | 347 2) |
| 1985 | 18,60 1) | 346 2) |
| 1984 | 18,03 1) | 344 2) |
| 1983 | 17,45 1) | 343 2) |
| 1982 | 17,33 1) | 341 2) |
| 1981 | 17,51 1) | 340 2) |
| 1980 | 17,75 1) | 339 2) |
| 1979 | 17,92 1) | 337 2) |
| 1978 | 17,39 1) | 333 3) |
| 1977 | 16,88 1) | 332 3) |
| 1976 | 16,32 1) | 331 3) |
| 1975 | 15,50 1) | 330 3) |
| 1974 | 15,42 1) | 328 3) |
| 1973 | 15,45 1) | 327 3) |
| 1972 | 14,61 1) | 326 3) |
| 1971 | 13,93 1) | 325 3) |
| 1970 | 13,65 1) | 324 3) |
| 1965 | 10,50 1) | 319 3) |
| 1960 | 8,70 1) | 316 3) |
| 1955 | 6,95 1) | 313 3) |
| 1950 | 5,57 1) | 311 3) |
| 1940 | 4,72 1) | 310 3) |
| 1930 | 3,85 1) | 307 3) |
| 1920 | 3,47 1) | 303 3) |
| 1910 | 3,00 1) | 299 3) |
| 1900 | 1,94 1) | 296 3) |
| 1860 | 0,36 4) | 286 3) |
- 1) IEA: CO2 emissions from energy combustion and industrial processes, 1900-2021
- 2) NOAA: Trends in globally-averaged CO2 determined from NOAA Global Monitoring Laboratory measurements
- 3) NOAA: Law Dome Ice Core 2000-Year CO2, CH4, and N2O Data
- 4) PIK: The PRIMAP-hist national historical emissions time series (1750-2019)
 Volker Quaschning and Bernhard Siegel, 11/2022.